WORLD electronics offers a complete line of electronic circuit board manufacturing and assembly services, as well as advanced manufacturing services. Our commitment to quality and service is second to no supplier.
Learn MoreOur team of engineers assists you in the development of new designs to optimize quality manufacturability (DFM) and testability, resulting in cost minimization and reduced product development time.
Learn MoreOur flexible manufacturing floor layout and highly trained staff allow for Quick Set-up and Tear Down of small volume prototype runs. This combination grants our customers the benefit of turning new designs quickly and accurately.
Learn MoreWORLD electronics is dedicated to quality. This quality is what underpins our commitment to thorough testing. Our engineers can develop a set of tests that ensure reliability and high performance in all products.
Learn MoreSupply chain management has crossed over from being a narrow management function to being a key operational function.
Learn MoreChoosing the best Amoled Screen in 2026 means looking beyond vivid colors and eye-catching brightness claims. Counterpoint Research’s Global Smartphone Display Panel Market Tracker and Omdia’s Smartphone Display Market Tracker follow panel shipments and market adoption. Their industry data helps explain why AMOLED appears across more phone categories, but shipment trends do not prove that one model looks better to you. That distinction matters.
Start with the details you can check: resolution, refresh rate, measured brightness, color accuracy, and warranty terms. A 6.7-inch screen with 1440 × 3200 pixels, for example, has roughly 525 pixels per inch. Yet sharpness alone will not fix harsh reflections on a sunny pavement or uncomfortable dimming in a dark bedroom. Look for independent laboratory tests that describe measurement conditions; peak-brightness figures often depend on small test areas and brief bursts. Check whether a review tests the exact phone, not a similar model.
There is no universal winner. Not even close. A commuter may value outdoor readability and battery life, while a photographer may prefer accurate color and consistent viewing angles. I would compare those everyday needs before paying extra for a headline specification. One caveat: published tests cannot fully predict how your eyes respond to flicker or color temperature. Try the display in person when possible, and treat one glowing review as evidence—not a verdict.
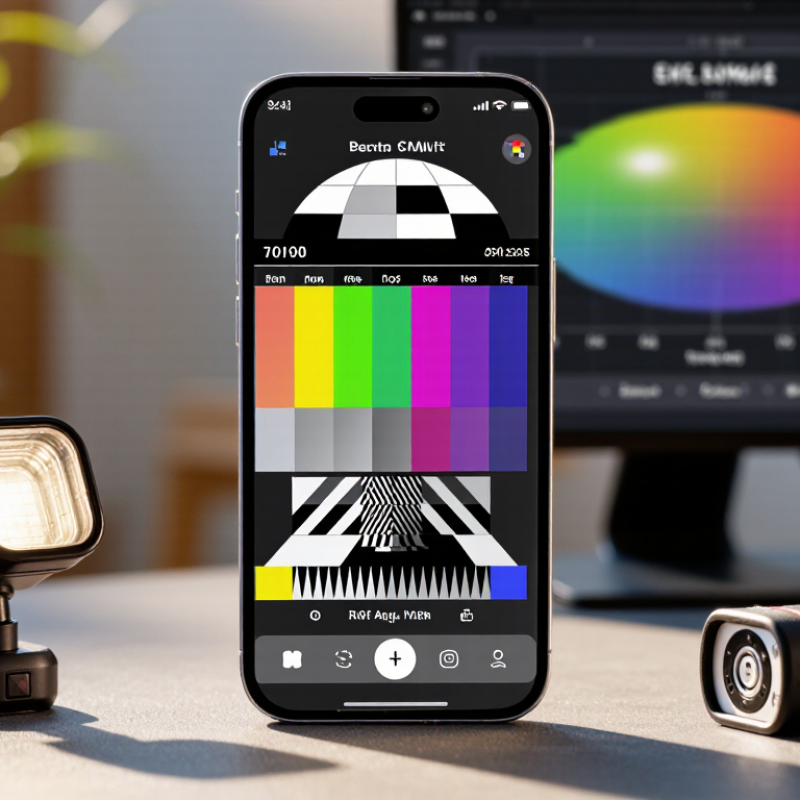
AMOLED describes a display family, not one fixed pixel layout. RGB OLED gives each pixel separate red, green, and blue subpixels. Fine text can look crisp, especially when viewed close up. PenTile layouts arrange subpixels differently and may share certain colors between neighboring pixels. This can save power or extend panel life, but edge detail may look softer at the same stated resolution. Numbers alone can mislead. Inspect small dark text against a pale background, then check thin diagonal lines at your usual viewing distance. Look closely.
LTPO refers to the backplane, the circuitry that controls each pixel. It can support variable refresh rates, lowering them on still screens and raising them during scrolling. That may reduce power use, though the benefit depends on software, brightness, and panel tuning. Watch a slow scroll, pause on a page, and notice whether motion stays smooth without sudden brightness shifts. A showroom check is imperfect; lighting and settings can hide flaws. I would weigh comfortable text and stable motion above a single specification, but personal eyesight changes the verdict. One panel may feel sharper, while another feels easier to read after an hour.
A sharp AMOLED image depends on more than its pixel count. Around 300 PPI usually keeps text clear at typical phone-viewing distances, while 400–500 PPI can make fine lettering and small icons look cleaner. The difference is easier to notice when you hold a screen close or read dense text. Screen size and viewing distance matter, too. Numbers alone cannot settle it.
Brightness needs careful comparison. A rating of 600 nits can be adequate indoors and in shade, while 1,000 nits or more may help outdoors. Claims above 2,000 nits often describe peak output on a small area, not the whole display for long periods. That distinction matters. Check whether a figure is sustained brightness, peak brightness, or measured in a specific mode. If possible, view a bright screen beside a window and look for readable text, not just vivid highlights. A specification sheet can still mislead.
Tips: Compare screens using the same text, brightness setting, and lighting. Look closely at small fonts, then tilt the display and check reflections. For brightness, test a mostly white page outdoors; a brief flash of peak brightness may not reflect everyday use.
When comparing AMOLED screens, treat DCI-P3 coverage as a useful starting point, not a promise of perfect color. A display with broad coverage can show richer reds and greens in compatible movies and photos. Check whether the specification reports measured coverage, and look for reviews that explain their testing method. Numbers without context can mislead.
Look closely. A 10-bit panel can show smoother color transitions than an 8-bit panel, especially in skies, shadows, and dim scenes. But some displays use processing to approximate 10-bit output. Check the panel details where available, then inspect gradients for visible banding. A quick store demo may not reveal it. I’ve found that screen brightness and room lighting can change what seems vivid, so comparisons are imperfect.
VESA DisplayHDR True Black 600 certification offers a more concrete HDR reference than a vague “HDR-ready” label. It indicates tested performance for peak brightness and deep black levels, qualities that suit AMOLED’s pixel-level dimming. Still, certification cannot guarantee that every scene will look natural. Watch a dark film clip with a bright subtitle, then check whether the subtitle blooms or the shadows lose detail. Not just numbers. A careful review should also mention HDR brightness behavior, color accuracy, and viewing conditions.
| Evaluation Dimension | Recommended Check | What It Tells You | How to Verify |
|---|---|---|---|
| DCI-P3 color coverage | Use 95% or higher as a practical target for wide-gamut viewing; higher coverage is preferable when color work matters. | Coverage indicates how much of the DCI-P3 color gamut the display can reproduce. It does not, by itself, indicate color accuracy. | Check an independent measurement report. Confirm whether it reports gamut coverage or gamut volume, since these are different measurements. |
| Color accuracy | For calibrated use, an average Delta E below 2 is a useful target; check the test method and color mode. | A lower Delta E generally means measured colors are closer to the reference colors. Results can differ between modes and after calibration. | Look for measured Delta E results, the color space tested, and whether the display was measured before or after calibration. |
| Color depth | Prefer a verified 10-bit signal and processing path. Check whether the panel is native 10-bit or uses 8-bit plus FRC. | 10-bit color represents 1,024 levels per channel, compared with 256 for 8-bit, and can reduce visible banding in gradients. The signal path and content must also support the intended depth. | Check technical specifications and independent tests. Confirm the supported input format, operating mode, refresh rate, and bit depth rather than relying on a “1.07 billion colors” claim alone. |
| HDR certification | Look for an actual VESA DisplayHDR True Black 600 certification when this performance class is a priority. | Certification indicates that a display has been tested against the applicable VESA requirements. The “HDR” label alone does not establish a particular performance level. | Verify the exact certification in VESA’s certified-product listings or documentation. Do not treat an unverified “600” claim as certification. |
| HDR peak brightness | Compare measured peak brightness with the window size and test duration stated; a 600 cd/m² result is meaningful only with its test conditions. | OLED brightness can vary with the size and duration of bright areas on screen. A small-window peak does not necessarily represent sustained or full-screen brightness. | Use independent measurements that specify the HDR mode, test-window size, duration, and brightness units (cd/m², also called nits). |
| Black level and dark-scene detail | Check measured black performance and shadow detail, as well as the applicable True Black certification. | AMOLED pixels can switch off to produce very dark areas, but reflections, room lighting, and near-black handling affect what you see. | Review dark-room measurements and near-black test patterns. Check for crushed shadow detail, raised blacks, and distracting reflections. |
| HDR tone mapping | Prefer natural highlight detail without obvious clipping, excessive dimming, or color shifts. | Tone mapping adjusts HDR content to the display’s capabilities. Two screens with similar peak brightness can render the same scene differently. | Read HDR image-quality reviews and compare the same HDR scenes or test patterns in the intended viewing mode. |
| Final buying check | Prioritize measured color coverage, verified bit depth, credible HDR testing, and viewing performance over a single headline specification. | Specifications describe separate aspects of performance; no single number guarantees accurate, bright, or consistently impressive HDR. | Compare independent test results under matching conditions, then consider room lighting, intended use, and the display’s available picture modes. |
When scrolling a long article, a 120 Hz display can make text movement look smoother than 60 Hz. Yet refresh rate and pulse-width modulation (PWM) frequency measure different things. Refresh rate describes how often the image updates; PWM describes how a screen may control brightness. A fast refresh rate alone does not prove low flicker or comfortable viewing. That distinction matters.
Check independent measurements at several brightness levels, especially the dim settings you use at night. Some screens reduce brightness by switching light output on and off. The effect can vary with frequency, modulation depth, and individual sensitivity. IEEE Std 1789-2015, written for LED lighting, gives a low-risk reference of under 4% modulation at 120 Hz. It is useful context, not a guarantee for phone displays or every viewer. Look for measured PWM frequency and modulation data, not just a “flicker-free” label.
A 60–144 Hz range can help you compare motion, but test real tasks: scroll small text, watch a moving cursor, and read against a dim background. Notice headaches, eye fatigue, or discomfort after a few minutes; take breaks and raise brightness if needed. These checks are practical, not clinical. And phone-camera flicker tests can mislead because camera shutters create banding. I would treat specifications as a shortlist, then trust a careful hands-on test.
A bright demo can hide how an AMOLED screen behaves over time. For burn-in checks, look at a gray image and a white screen after displaying fixed icons at high brightness for extended periods. Faint status-bar shapes may reveal uneven pixel wear, but a brief shop test cannot predict years of use. Burn-in risk depends on brightness, screen time, and varied content. There’s no perfect shortcut.
Tips: Lower brightness when practical, enable screen sleep, and avoid leaving static images onscreen. Check for a uniform gray field in a dim room. Don’t confuse temporary image retention with permanent burn-in; let the display rest, then inspect again.
LTPO can vary refresh rates across a range such as 1–120 Hz, reducing unnecessary updates when content is still. Scrolling may feel smoother at higher rates, while a static page can use less power at a lower rate. Actual battery savings depend on software, brightness, and what you’re viewing. Ask whether adaptive refresh works in your usual apps. I’d still compare real-world battery reports with hands-on testing; specifications alone can be a little too reassuring.