Air Monitoring has become essential for understanding the air people breathe in cities, factories, laboratories, and remote communities. Modern equipment measures particulate matter, ozone, nitrogen dioxide, sulfur dioxide, carbon monoxide, and other pollutants. Yet accuracy depends on more than a sensor’s advertised range. It also depends on calibration, humidity control, maintenance, data handling, and field experience.
Dr. Maria Neira, Director of the World Health Organization’s Department of Environment, Climate Change and Health, has described air pollution as “the new tobacco.” Her warning gives this market a clear public-health context. Reliable monitoring equipment can reveal pollution peaks near busy roads, dust around construction sites, or fine particles entering a school through an open window. Small details matter.
This overview examines top Air Monitoring equipment manufacturers worldwide. It considers instrument accuracy, detection limits, response time, software quality, service networks, and long-term operating costs. It also looks at equipment designed for regulatory stations, industrial facilities, occupational environments, and research projects. No instrument is perfect. That point deserves attention.
A costly analyzer may still produce weak results if technicians neglect calibration. A compact sensor may offer valuable local insight, but it can drift under heat or moisture. Manufacturer claims should therefore be compared with independent testing, recognized standards, and documented field performance. Experience matters here. So does transparency.
The strongest manufacturers usually combine dependable hardware with clear data records and practical technical support. Their products help experts move from vague concern to measurable evidence. That evidence supports better decisions, though it never replaces professional judgment.
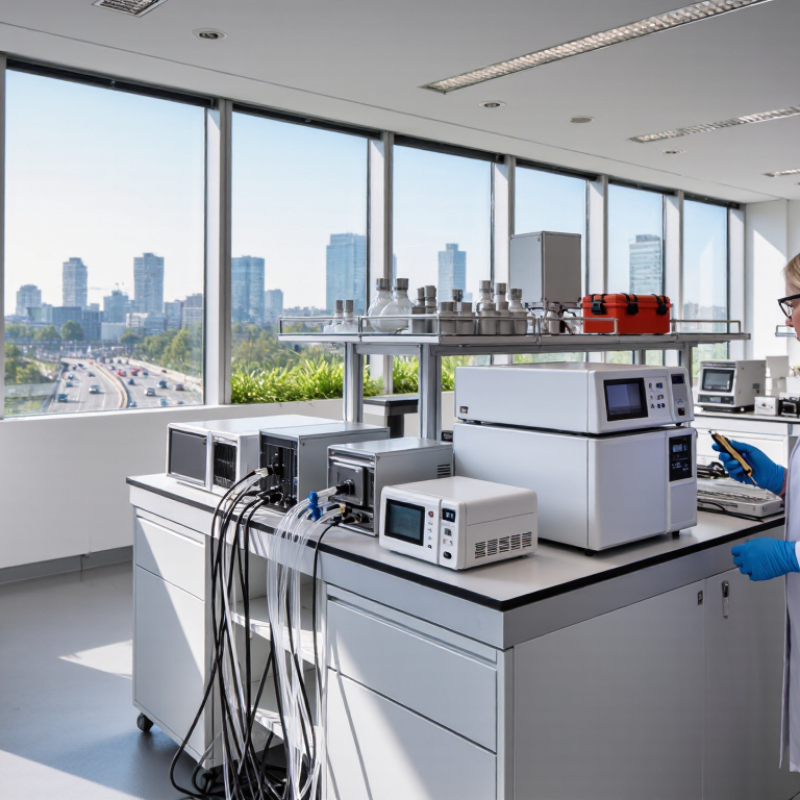
Air monitoring equipment measures pollutants and conditions that affect the air people breathe. It can track particulate matter, carbon monoxide, nitrogen oxides, ozone, humidity, and temperature. Some systems remain fixed on rooftops, while portable units follow technicians through buildings, roads, and industrial areas. The data shows what human senses cannot. A clear room may still contain fine particles that enter deep into the lungs.
This equipment matters because air quality changes quickly and unevenly. A cooking area, loading bay, or busy intersection can create short exposure peaks. Accurate sensors help safety teams identify sources, compare locations, and decide when ventilation needs attention. They also support environmental studies and public communication when readings are collected consistently. Yet a number on a screen is not automatically truth. Calibration, sensor placement, weather, and maintenance can change the result.
In practical fieldwork, trained users check the instrument before each survey. They record the time, location, operating conditions, and unusual events nearby. A low-cost monitor may be useful for trends, but it can misread certain gases or particles. That limitation should be stated clearly. Professional monitoring combines suitable equipment, quality checks, and human judgment. Even then, interpretation deserves caution. Air data is evidence, not a perfect verdict.
| Equipment Category | Primary Pollutants or Variables | Common Measurement Principle | Typical Measurement Range | Typical Use Environment | Key Performance Considerations | Relevant Reference or Guideline |
|---|---|---|---|---|---|---|
| Particulate Matter Monitor | PM1, PM2.5, PM10, total suspended particles | Optical particle counting or light-scattering photometry | Approximately 0–1,000 µg/m³ for many ambient applications | Urban air-quality stations, industrial boundaries, construction sites, schools, offices and homes | Particle size calibration, humidity interference, inlet design, flow stability and data averaging time | ISO 4224; United States EPA Federal Equivalent Method requirements may apply to regulatory instruments |
| High-Volume Particulate Sampler | PM10, PM2.5, total suspended particles and filter-collected chemical constituents | Controlled-volume air sampling through a size-selective inlet and filter | Common flow rates include approximately 16.7 L/min for PM2.5 samplers and approximately 1.13 m³/min for some high-volume systems | Regulatory monitoring, gravimetric analysis, metals, ions, elemental carbon and laboratory studies | Filter conditioning, sampling duration, flow-rate accuracy, inlet cut-point and laboratory weighing procedures | U.S. EPA 40 CFR Part 50; EN 12341 for PM10 and PM2.5 reference measurement methods |
| Ozone Analyzer | Ground-level ozone, O3 | Ultraviolet absorption near 254 nm | Common ambient ranges include 0–0.5 ppm; instrument ranges vary by application | Photochemical smog monitoring, urban networks, industrial and research sites | UV lamp stability, zero-air quality, humidity effects, photometric accuracy and periodic calibration | U.S. EPA Reference Method for Ozone; ISO 13964 |
| Nitrogen Oxides Analyzer | Nitric oxide, nitrogen dioxide and total nitrogen oxides: NO, NO2 and NOx | Chemiluminescence, often with a converter for NO2 measurement | Common ambient ranges include 0–0.5 ppm | Traffic corridors, urban background stations, combustion sources and industrial monitoring | Converter efficiency, ozone supply, interference control, span-gas accuracy and sample-line conditioning | ISO 7996; U.S. EPA reference and equivalent method requirements for NO2 |
| Sulfur Dioxide Analyzer | Sulfur dioxide, SO2 | Ultraviolet fluorescence | Common ambient ranges include 0–0.5 ppm | Industrial areas, fuel-combustion sources, ports and regional air-quality networks | Hydrocarbon interference, converter condition, zero drift, calibration-gas traceability and sample humidity | ISO 10498; U.S. EPA reference and equivalent method requirements for SO2 |
| Carbon Monoxide Analyzer | Carbon monoxide, CO | Non-dispersive infrared absorption | Common ambient ranges include 0–50 ppm | Roadside monitoring, garages, tunnels, combustion areas and indoor environments | Water vapor and carbon dioxide interference, optical-path cleanliness, zero stability and response time | ISO 4224; local occupational and indoor-air regulations may specify different limits |
| Volatile Organic Compound Monitor | Non-methane hydrocarbons, total VOCs and selected compounds such as benzene | Photoionization detection, flame-ionization detection or gas chromatography | From parts per billion to parts per million, depending on the compound and method | Industrial fence lines, solvent-use areas, remediation sites, laboratories and indoor-air investigations | Compound-specific response factors, humidity effects, selectivity, sampling-line adsorption and calibration standards | ISO 16000 series; U.S. EPA TO-15 and TO-17 for selected ambient VOC methods |
| Ammonia and Reactive Gas Monitor | Ammonia, hydrogen sulfide, chlorine, hydrogen fluoride and other reactive gases | Electrochemical sensing, tunable diode laser absorption or chemical conversion methods | Often from low parts-per-billion levels to tens or hundreds of parts per million | Agriculture, wastewater treatment, chemical production and emergency-response monitoring | Cross-sensitivity, sensor poisoning, temperature compensation, humidity and short-term peak detection | Method selection should follow the target compound, applicable occupational limits and local regulations |
| Meteorological Sensor Package | Wind speed, wind direction, temperature, relative humidity, pressure and precipitation | Ultrasonic, cup-and-vane, capacitive, thermistor, barometric and tipping-bucket technologies | Typical variables include wind speed from 0–60 m/s, relative humidity from 0–100% and temperature from approximately −40 to 60 °C | Air-quality stations, dispersion modeling, industrial sites, airports and environmental research | Exposure height, siting clearance, sensor alignment, icing, turbulence and calibration interval | WMO guidance; ISO 1996-2 may be relevant when meteorological data support environmental noise studies |
| Indoor Air Quality Monitor | PM2.5, CO2, temperature, relative humidity and sometimes VOCs or CO | Combination of optical, nondispersive infrared, electrochemical and capacitive sensors | CO2 commonly measured from 0–5,000 ppm; PM2.5 ranges vary by sensor design | Homes, offices, schools, hospitals, hotels and commercial buildings | Ventilation interpretation, sensor placement, occupancy effects, calibration drift and alarm thresholds | ASHRAE Standard 62.1 and 62.2 address ventilation; CO2 is generally used as a ventilation indicator rather than a complete IAQ metric |
| Remote Sensing System | Large-area distributions of particulate matter, ozone, nitrogen dioxide and aerosol properties | Lidar, differential optical absorption spectroscopy, satellite retrievals or open-path spectroscopy | Range depends on atmospheric conditions, path length, optical configuration and retrieval algorithm | Regional air-quality assessment, industrial corridors, wildfire smoke and atmospheric research | Line-of-sight limitations, weather dependence, retrieval uncertainty, spatial representativeness and validation against reference stations | Data should be validated against applicable ground-based reference or equivalent methods |